Some Charts
Let’s cover some fundamental investment principles with charts!
Here you go…
(This newsletter contains a lot of charts and data. All of it is for informational purposes only and is not investment advice. If you want some investment advice just ask me by replying to this email. Past performance not indicative of future results).
Growth over time.
To start, here’s the growth of a dollar over the last 50 years if hypothetically invested in the MSCI World Stock Index.
At the end of the 50 years, one hypothetical dollar has grown to eighty.
Be sure to note the two dozen negative events which presented more than enough motivation to abandon a long term strategy. With a small enough font or a big enough chart, I could easily add 100 more potential reasons to sell, all of which would likely look foolish in hindsight.
The best reasons to sell an investment, in my opinion, are if you actually need the money to fund one of the things you were investing for in the first place,like retirement, education, or to go to an NBA Finals game (go Suns).
Days, not decades.
The chart above shows the potential for stocks to be rewarding over several decades. However, Life is a bit different than that. Life happens when we stack a bunch of individual days on top of one another and then, as if almost suddenly, decades have elapsed.
It’s hard to rewire our thinking to shift focus from the day-to-day, but it’s incredibly important. Time is our friend, particularly when you consider the historical performance of the US Stock Market (represented by the S&P 500 index below).
As you can see, more time = better historical likelihood of a positive outcome.
*past performance is not a guarantee of future performance.
But what if we could get out before a bad event, that would be good right?
Yes, that wouldn’t just be good. That would be AMAZING.
The problem with that is there is just as high a likelihood that you get out before the best days and end up missing out, and the impact of missing just a few of the market’s best days can be profound, as this look at a hypothetical investment in the stocks that make up the S&P 500 Index shows.
Staying invested and focused on the long term helps to ensure that you’re in position to capture what the market has to offer when things are good.
• A hypothetical $1,000 turns into $20,451 from 1990 through 2020.
• Miss the S&P 500’s five best days and the return dwindles to $12,917.
• Miss the 25 best days and that’s $4,376.
• There’s no proven way to time the market—targeting the best days or moving to the sidelines to avoid the worst—so history argues for staying put through good times and bad.
Think of it this way: The bad days are the price of admission for getting to experience the good days. Try to accept the whole experience.
Does a recession mean a bad upcoming performance session for stocks? If so, what kind of concessions should we make about this post-recession session?
(Say that 10 times fast)
I have good news. We don’t really need to make post-recession concessions in fear of stock market corrections.
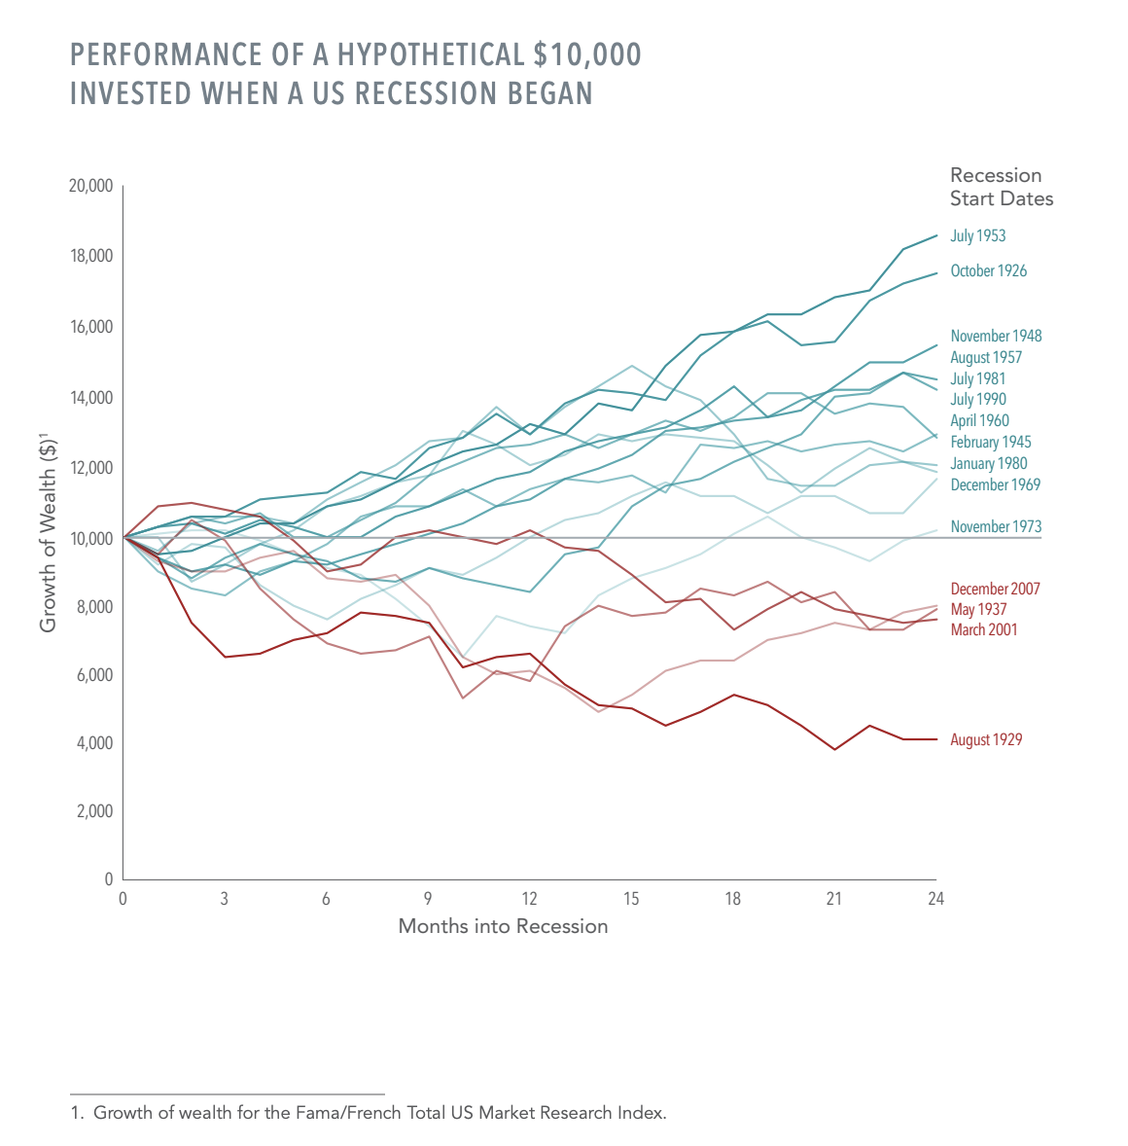
Check out this image below which shows the hypothetical performance of $10,000 invested right when a US recession began and held for 24 months.
In the past century, there have been 15 recessions in the US. In 11 of those instances, stock returns were positive two years after the recession began.
The average annualized return two years after the onset of these 15 recessions was 7.8%.
A $10,000 investment at the peak of the business cycle would have grown to $11,937, after two years on average.
When we hear “the economy is in a recession” investors may be tempted to abandon stocks and go to cash when there is heightened risk of an economic downturn. But research has shown that stock prices incorporate expectations of a recession and generally have fallen in value before a recession even begins.
In short, you have to predict a recession before it happens (i.e. when things are good) and before most market participants start predicting the recession. That’s a lot of predicting, I think there’s a better way.
Recessions understandably trigger worries. But a history of positive average performance following a recession can be a comfort for investors wondering about sticking with stocks.
Owning the winners, avoiding the losers
Okay, we know that having a long term focus is good.
We know that jumping in and out of the stock market is hard and can be costly.
Know know our likelihood of a good outcome increases with time.
And we know that the onset of a recession is not necessarily a reason to change strategy.
What about picking individual stocks rather than owning a broadly diversified mix? See below:
The chart above shows something amazing. Over the 26 years from 1994-2020, if you owned all stocks in the world, your rate of return is 8.2% per year.
If you don’t own the top 10% of best performing stocks, the annual rate of return drops to 3.6%.
If you don’t own the top 25%, the annual rate drops to negative 4.7%!… Wow.
Of course, this is hypothetical, but it’s worth exploring a bit more.
If you were picking stocks, you wouldn’t be some dummy who buys those bad performers, right? You’d try to buy only those in the top 10% or better.
Unfortunately, everyone is trying to do that. And remember, every single stock in existence is owned by someone who, presumably, thinks that stock is a good investment.
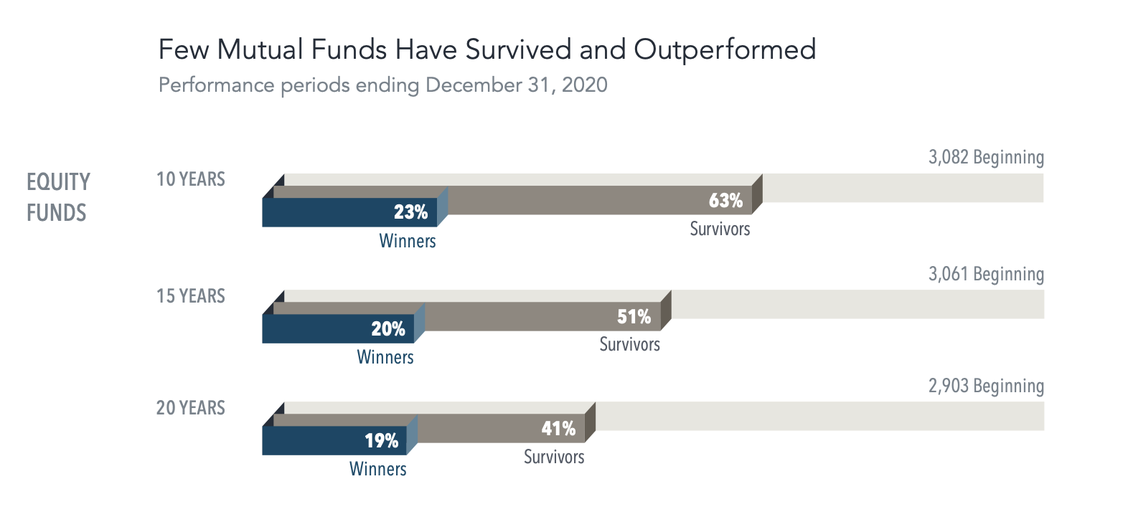
In the past I’ve shared this below graphic and I continue to highlight it because the message bears repeating. This is the % of US-Based stock mutual funds which have beat the market.
Above you can see that 23% of US stock picking mutual funds beat their market over the last 10 years, 20% beat the market over the last 15 years, and 19% beat the market over the last 20 years.
These are the institutions who are trying to find the top performers in advance and they have WAY more resources and expertise to do so than you or I do. Yet the success rate hovers around 1 in 5.
1 in 5 funds are estimated to beat the market and you can see how picking and choosing from individual companies increases the likelihood of missing the best performing stocks and adversely affecting performance.
If the return of owning all stocks has been solid, and the potential downside of missing the best stocks is significant, the case for being broadly diversified starts to be made.
Conclusion
There are a lot of successful paths to accumulate wealth. Luck and skill both play a part in investment management and there is always some gray area to allow for flexibility in a strategy, but having a set of baseline principles is important. These are just a few of the building blocks to a broader set of principles I use to advise investments.
Establishing this set of investment principles is hard. It takes time. It takes convictions and you have to constantly challenge those convictions to help ensure you’re not overlooking something.
Before starting this firm I was an advisor in other practices where we did things quite differently. That experience was invaluable and it was a big part of what lead me down the path I’m on today…. But more on that experience in my next newsletter (next week).
If you have any questions, as always, let me know.
Onward,
Adam Harding | CFP | Advisor | Owner @ Harding Wealth Inc. | Smartvestor
Mobile Number: 480-205-1743
Copyright (C) 2021 Harding Wealth, Inc. All rights reserved.


